Introduction to Geospatial data
“Humanity today is faced with numerous challenges. The world we humans have created and in which we find ourselves is unlike any world of the past; and a return to the past is not a possibility. Many of these challenges can be addressed with geospatial technology, especially if that technology is built appropriately, is sufficiently comprehensive, and is open and accessible to all.” (Dangermond and Goodchild, 2020)
Geoespatial technology deals with geospatial data. It absorvs the knowledge from a distinct disciplines and activities such as:
- Geodesy: the science of measuring and representing the size and shape of Earth
- Mapping: measurement of a position, na elevation, a perimeter or an area to define positional information on Earth
- Remote Sensing: science related to obtaining data from distance using devices that detect emitted or reflected electromagnetic energy
- Cartography: art and science of making maps to communicate geospatial information
- Geospatial Science: a multidisciplinar field of research and application using geographic information and technology to answer scientific questions as they relate to both space and time
- Geographic Information Systems (GIS): combines hardware, software, data and scientific methods to store, analyze, produce and dip lay geospatial data.
Geospatial data and geospatial technology are suited to answer a lot of interesting questions.
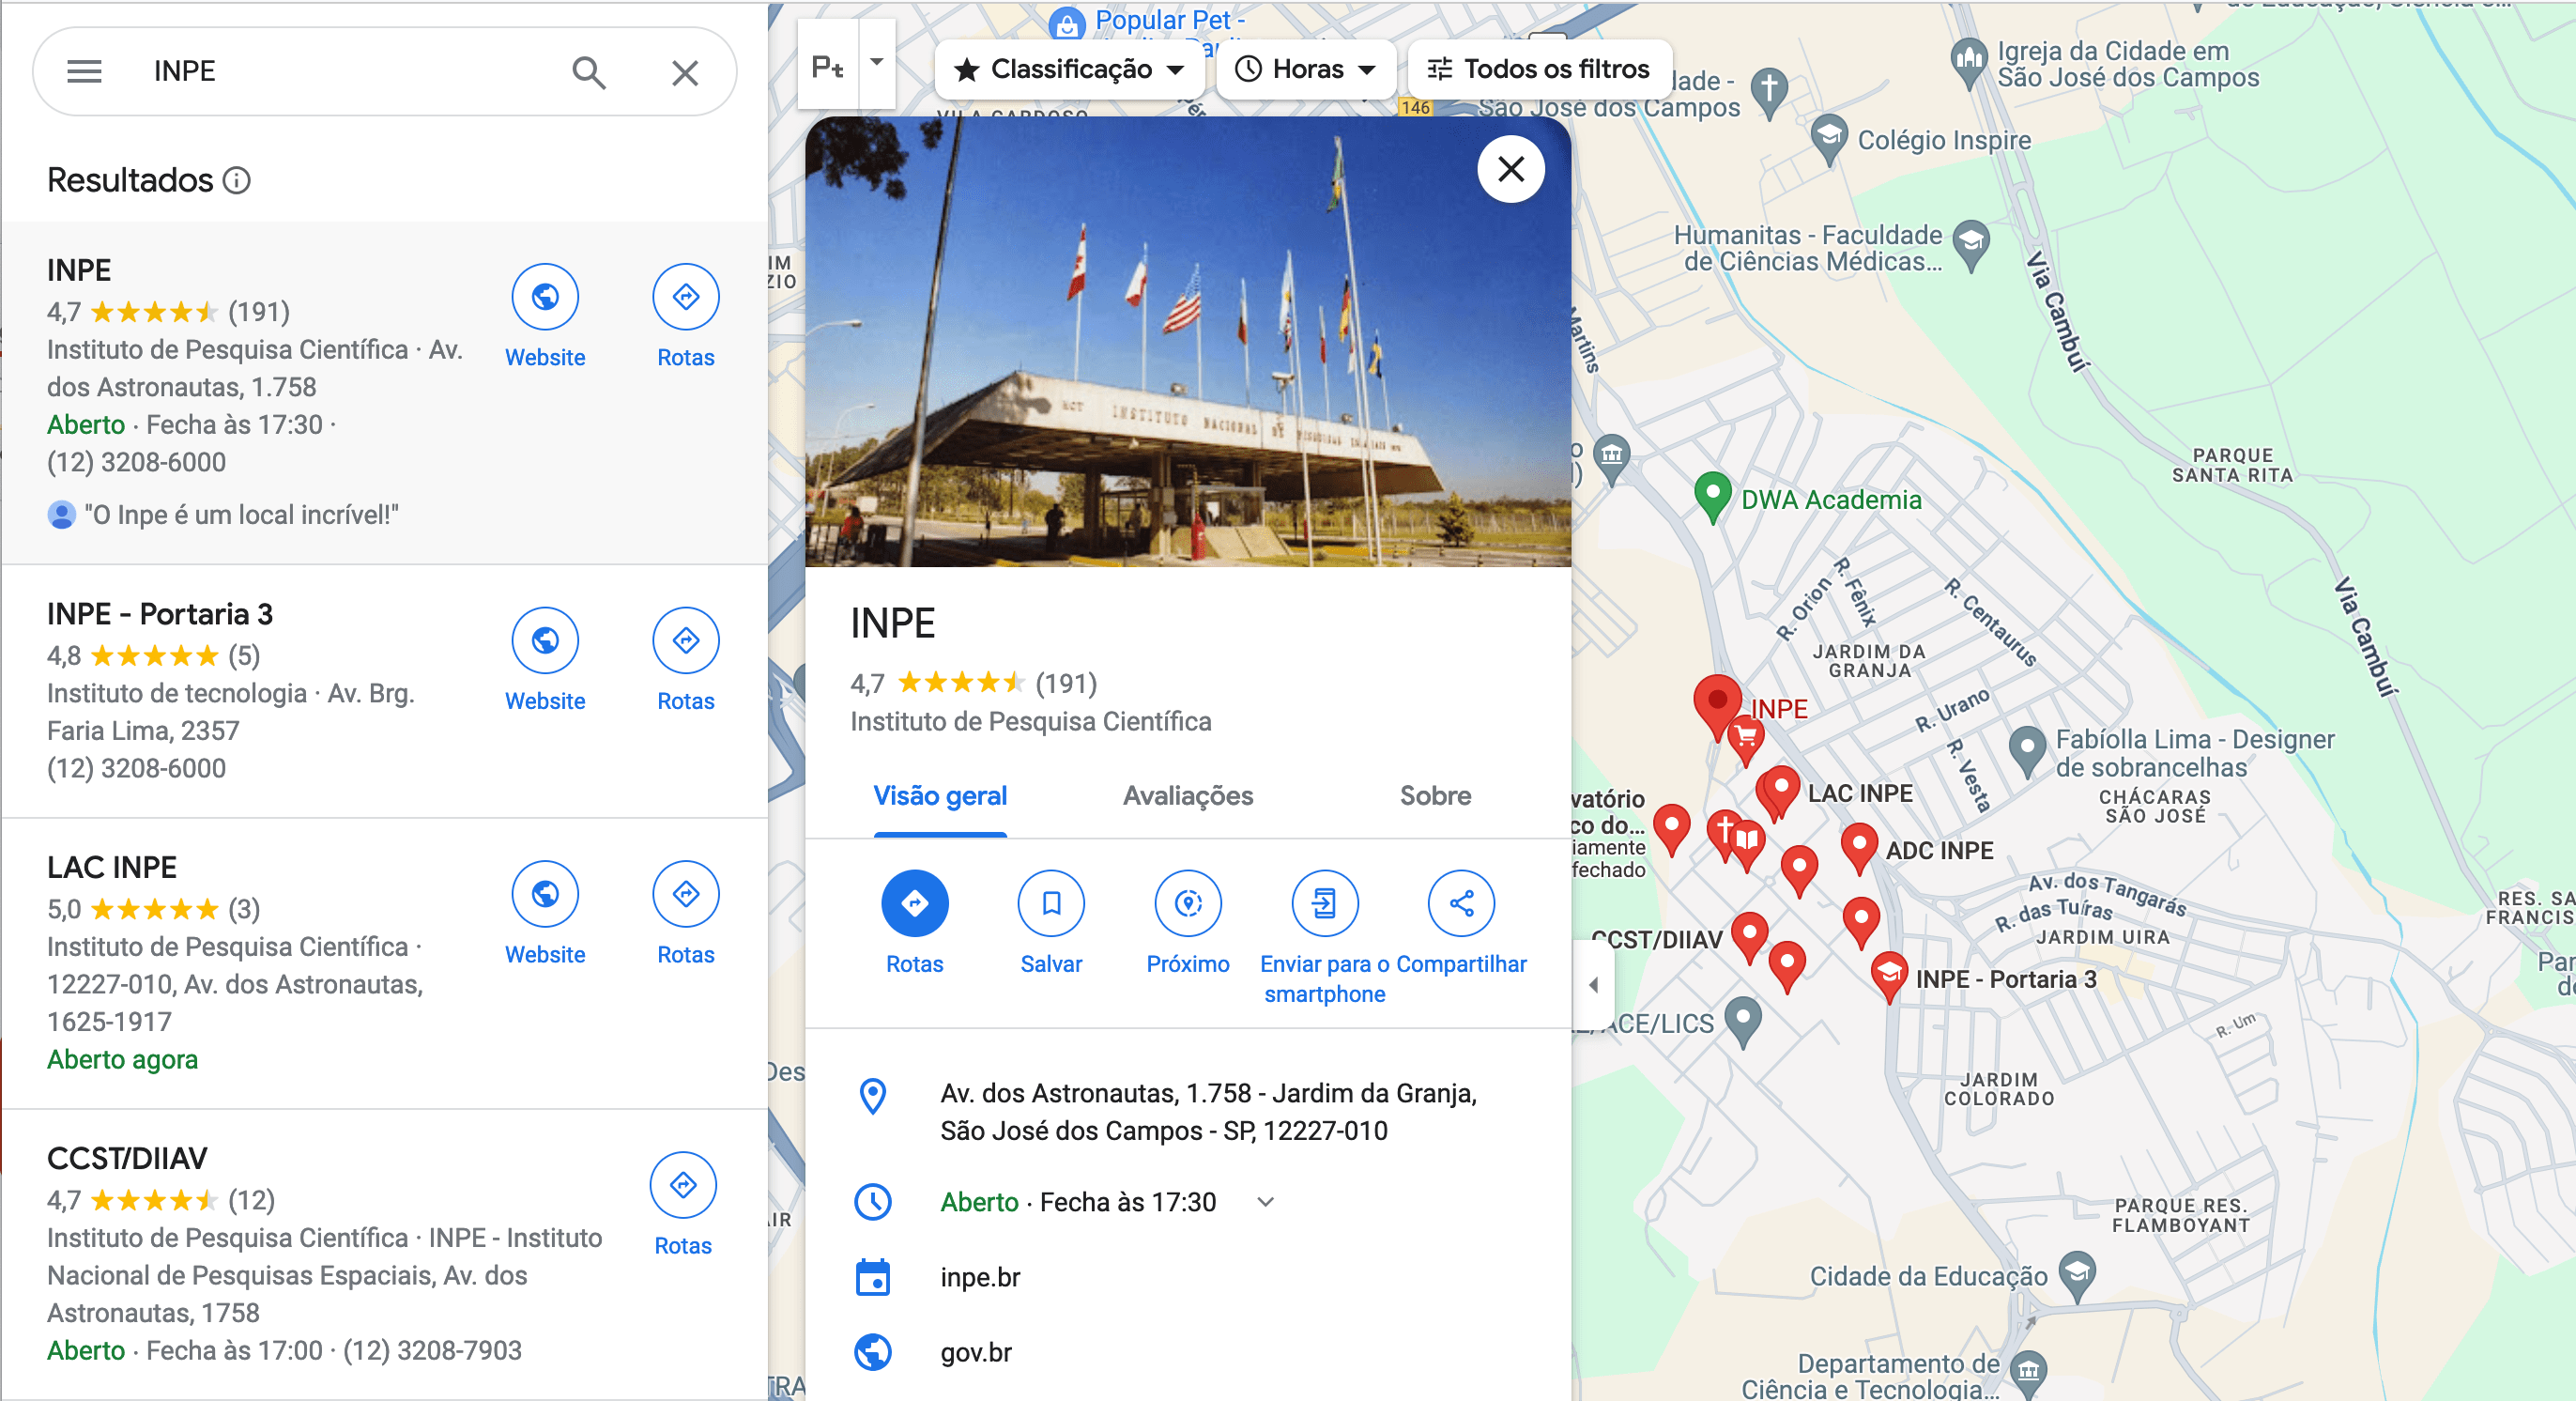
Location:
Where entities are located?
Spatial analysis:
Spatial analysis refers to the transformation and manipulation of data to create added value, aiming to answer questions (Camara et al., 2000). For example:
- Where do things happen? Patterns, clusters, hot spots, and disparities.
- Why do they happen where they happen? Location decisions.
- How does where things happen affect other things (context, environment), and how does context affect what happens.
- Where should things be located?
As a classic example, in 1854, Dr. John Snow used the power of mapping to identify the source of a cholera outbreak in London. The dots indicates cholera deaths in the city and the ‘x’s where the water pumps . His work contributes to the identification of how cholera is transmitted.
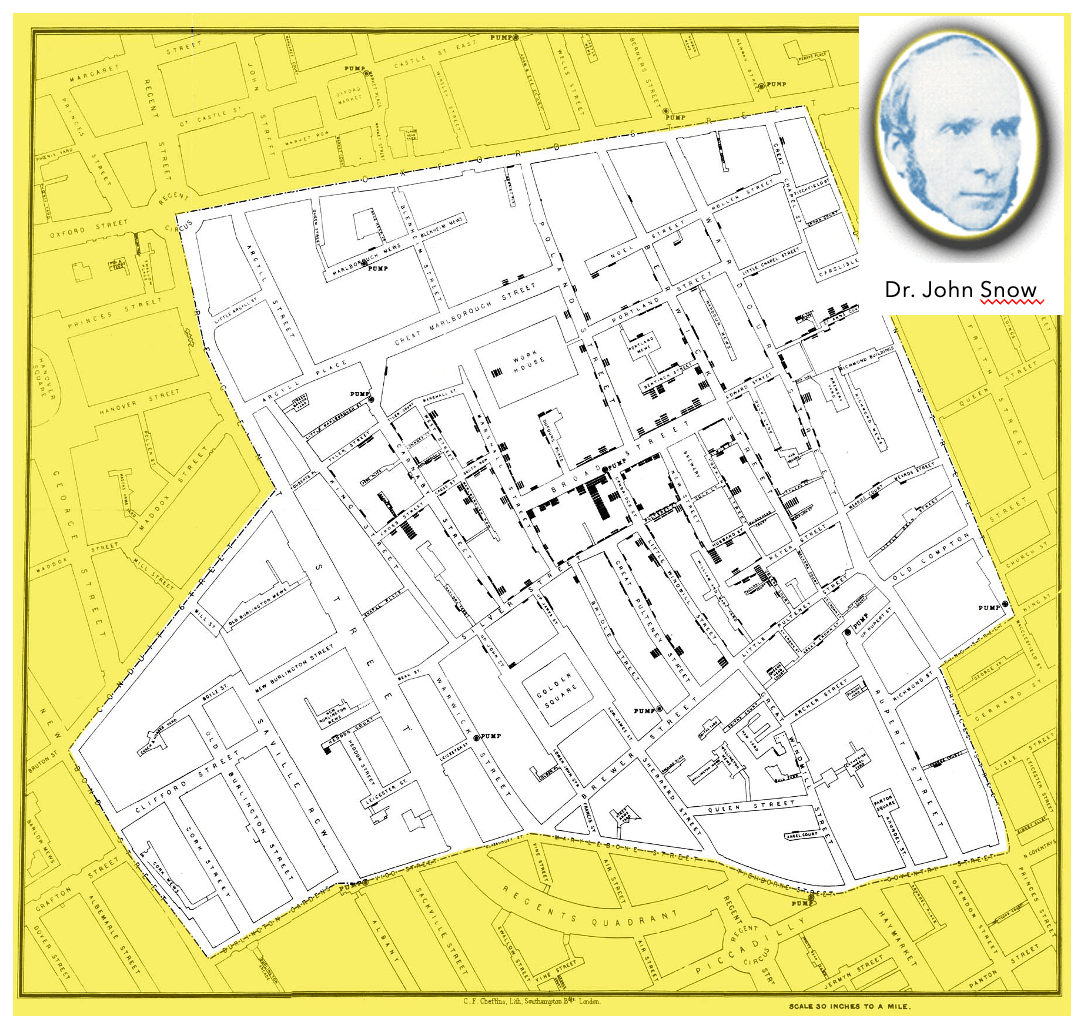
Source: John Snow site.
Geographic distribution or extent
What the extension of geographical entities?
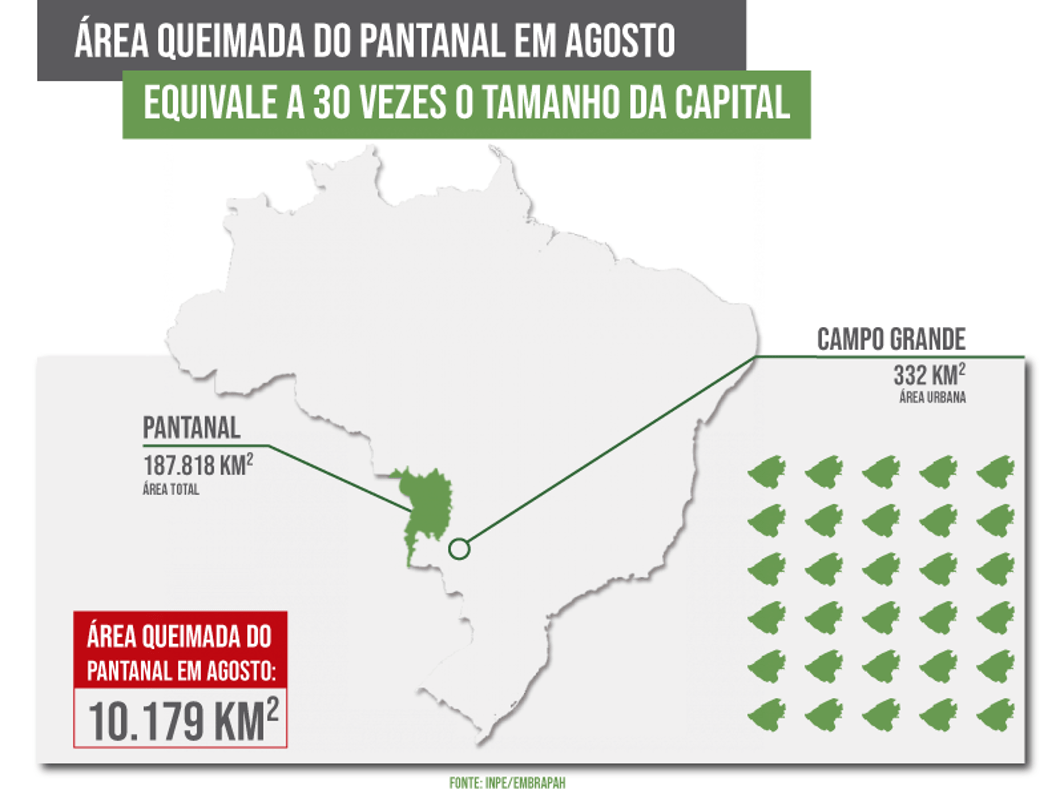
Source: Campo Grande News, 2020
Spatial relationships
- Do the entities contain one another?
- Do they overlap?
- Are they connected?
- Are they situated within a certain distance of one another?
- Where are entities with similar attributes located?
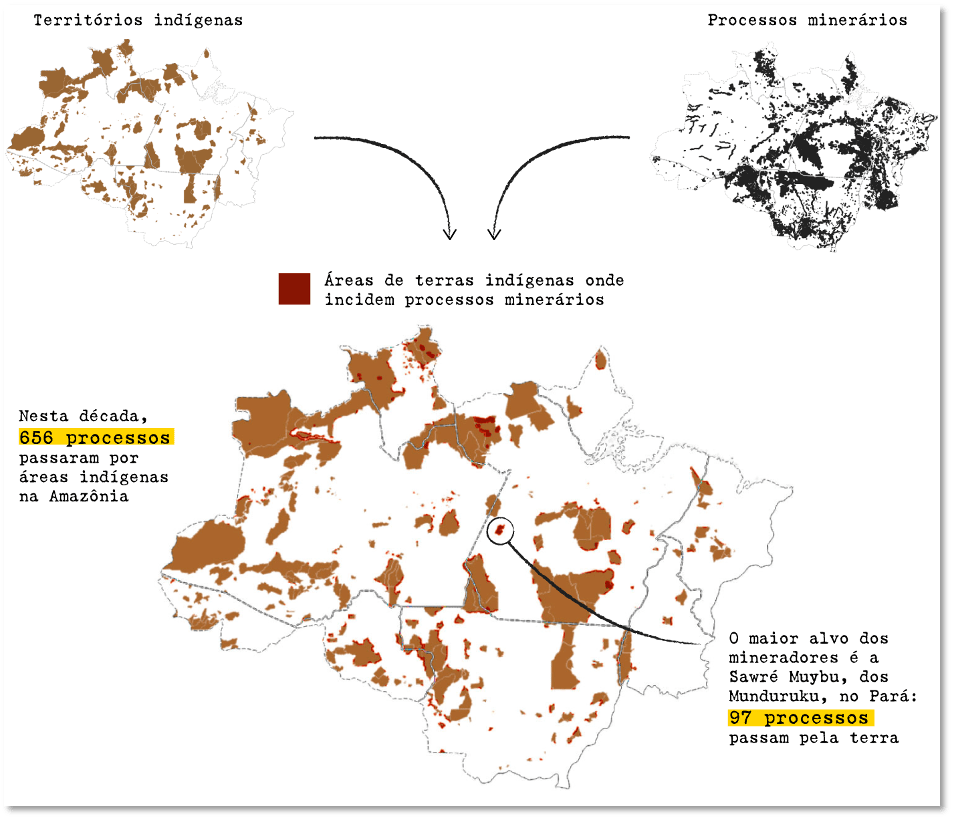
Source: El País, 2020
Geographical Information Systems (GIS)
The advances in data storage and the processing power of mainframe computers, led to developent of systems able to handle geospatial data. The geographer Roger Tomlinson is considered the father of GIS was responsible for the creation of the Canadian Geographic Information System (CGIS) to store, analyze and manipulate data that was collected for the Canada Land Inventory (CLI). In a report of 1962 Dr Tomlin indicates the feasability of using computers to storage, compilation and assessement of maps and statistical data.
In 1975 the first Geographical Information System (GIS) was developed at Laboratory for Computer Graphics, in Harvard. By the late 1970s, the progress in computer memory and improved computer graphic capabilities led to the creation of commercial GIS Software (Waters, 2017). A GIS can be defined as computer system for capturing, storing, checking, and displaying geospatial data.
Several software projects focus on the development of Free and Open Source GIS, or FOSSG. These developments include not only desktop applications but other different categories of FOSSG such: (i) Desktop GIS, (ii) Spatial Data Base Management Systems (SDBMS), (iii) Web Map Server, (iv) Server GIS, (v) Web GIS clients, (vi) Mobile GIS, and (vii) Libraries and Extensions (Steineger and Hunter, 2012). A list of GIS tools can be seen in the Awesome Geospatial project.
FOSS4G at the National Institute for Space Research (INPE)
INPE has a long history of development FOSS4G products:
| Product | Description | Year | Ref |
|---|---|---|---|
| SITIM/SGI | MS-DOS software and locally developed graphics card. It allowed integrating images into maps and other ground measurements | 1986 | SITIM/SGI |
| SPRING | First GIS to integrate image and vector data processing, spatial analysis, numerical terrain modeling and spatial databases into a single computing environment. | 1990 | (SPRING) |
| TerraLib | Open source library to support the develpment of innovative geospatial applications | 2000 | TerraLib/TerraView |
| TerraView | General purpose GIS developed using TerraLib | 2000 | TerraLib/TerraView |
| TerraAmazon | Tool based on TerraLib to process all data and deliver the deforestation maps and annual rate produced by INPE, on a full open source environment. | 2007 | TerraAmazon |
| TerraMA2 | Computational system, based on an open service architecture, which provides the technological infrastructure necessary for the development of operational systems for monitoring environmental risk alerts | 2009 | TerraMA2 |
| TerraHidro | Platform for distributed hydrological modeling, to simulate environmental situations, related to surface and/or underground water resources. | 2009 | TerraHidro |
| GEODMA | Toolbox for integrating remote sensing imagery analysis methods with data mining techniques producing a user-centered, extensible, rich computational environment for information extraction and knowledge discovery over large geographic databases | 2009 | GeoDMA |
| Brazil Data Cube | Platform to explore large volumes of Earth Observation Data | 2019 | BDC |
| sits | Satellite Image Time Series Analysis on Earth Observation Data Cubes | 2020 | sits |