Geospatial data representation
What is special about geospatial data?
Data are values assigned to something. These values can be numbers but also, for example, concepts or positions on a map. Data can be measured using instruments but can also be arbitrarily assigned (Escola de Dados).
Geospatial data has specific properties, distinguishing it from other types of data:
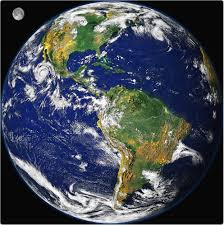
- It must always fit into the framework of geographic space, which is a model of the Earth that is continuous, three-dimensional, and roughly spherical.
- It collects information containing non-spatial attributes that correspond to a specific location and extent in space and time.
- It is dependent on the physical features of geographic space.
- It can be represented graphically via a map.
- Is a selective and generalized representation of the real world.
The essential characteristics of geospatial data:
- The semantic coverage: what is observed or measured
- The spatial coverage: where is data was observed or measured
- The temporal coverage: when the data was observed or mesaured
Some examples
An image
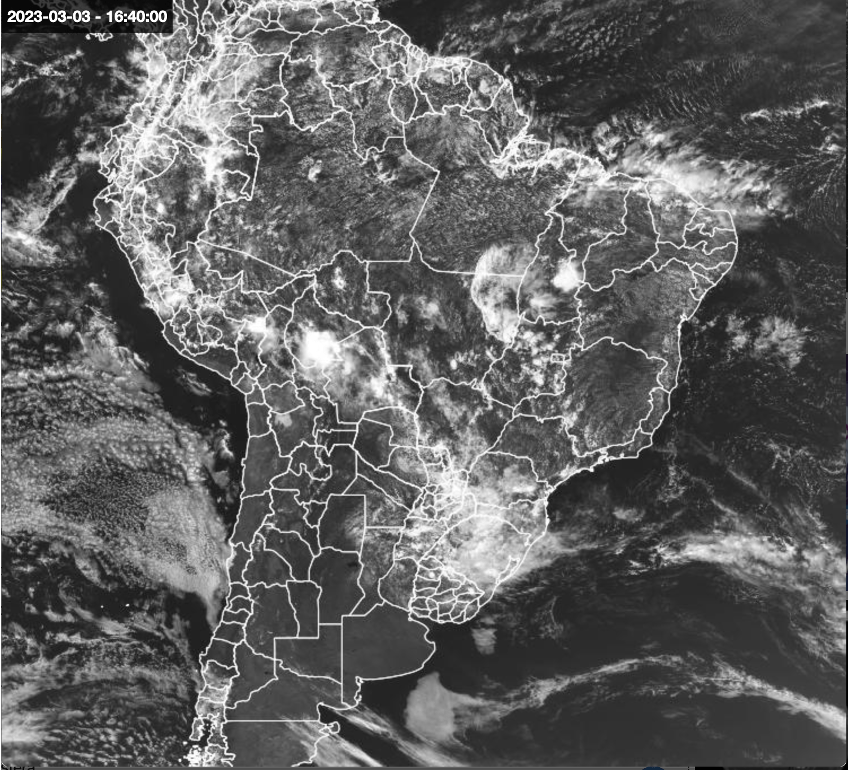
Source: CPTEC/INPE.
| What | Measurements from channel 2 of GOES-16 satellite (cloud dynamics) |
| Where | South America |
| When | 11/03/2021 09:00 |
| Aquisition | Collected by a sensor onboard an orbiting satellite |
A map
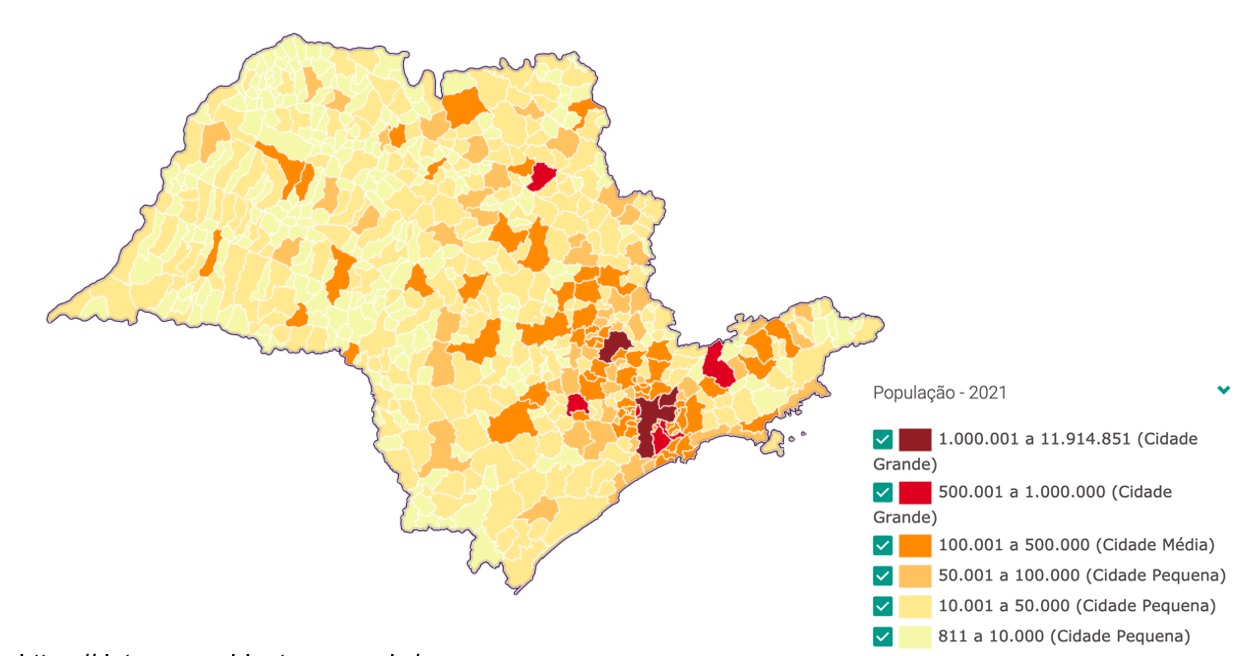
Source: Datageo.
| What | Population per municipality |
| Where | Municipalities of São Paulo State, Brazil |
| When | 2021 |
| Aquisition | Collected by demographic census campaing (direct interview) |
Digital representation of geospatial data
The structural characteristic of GIS and geospatial applications is the data overlay. Every semantically distinct data set is modeled as a different data layer. Through GIS, many different layers of data can be analyzed and combined, generating final data and products.
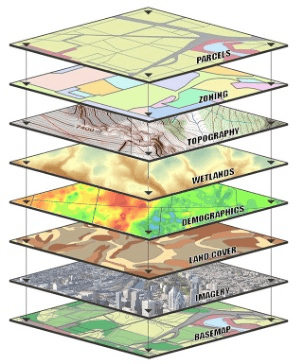
Source: (Kolios et al., 2017).
Conceptually, geospatial data can also be modeled as fields to describe phenomena that are continuous in space. For example: elevation data, soil type data. Or objects to represent a set of discrete objects, or features, characterized properties. For example: the streets, schools, parcels of a region.
Raster and Vector models
To represent digitally geospatial data two models can be used: vector or raster. The vector representation is based on the use of geometrical primitives (points, lines and polygons) to describe the data spatial coverage (location). It is usually used with data modelled as objects.
 |
Point (or node), a bidimensional coordinate in a spatial reference system |
 |
Line, a sequence of nodes |
 |
Polyon (or area), a closed line |
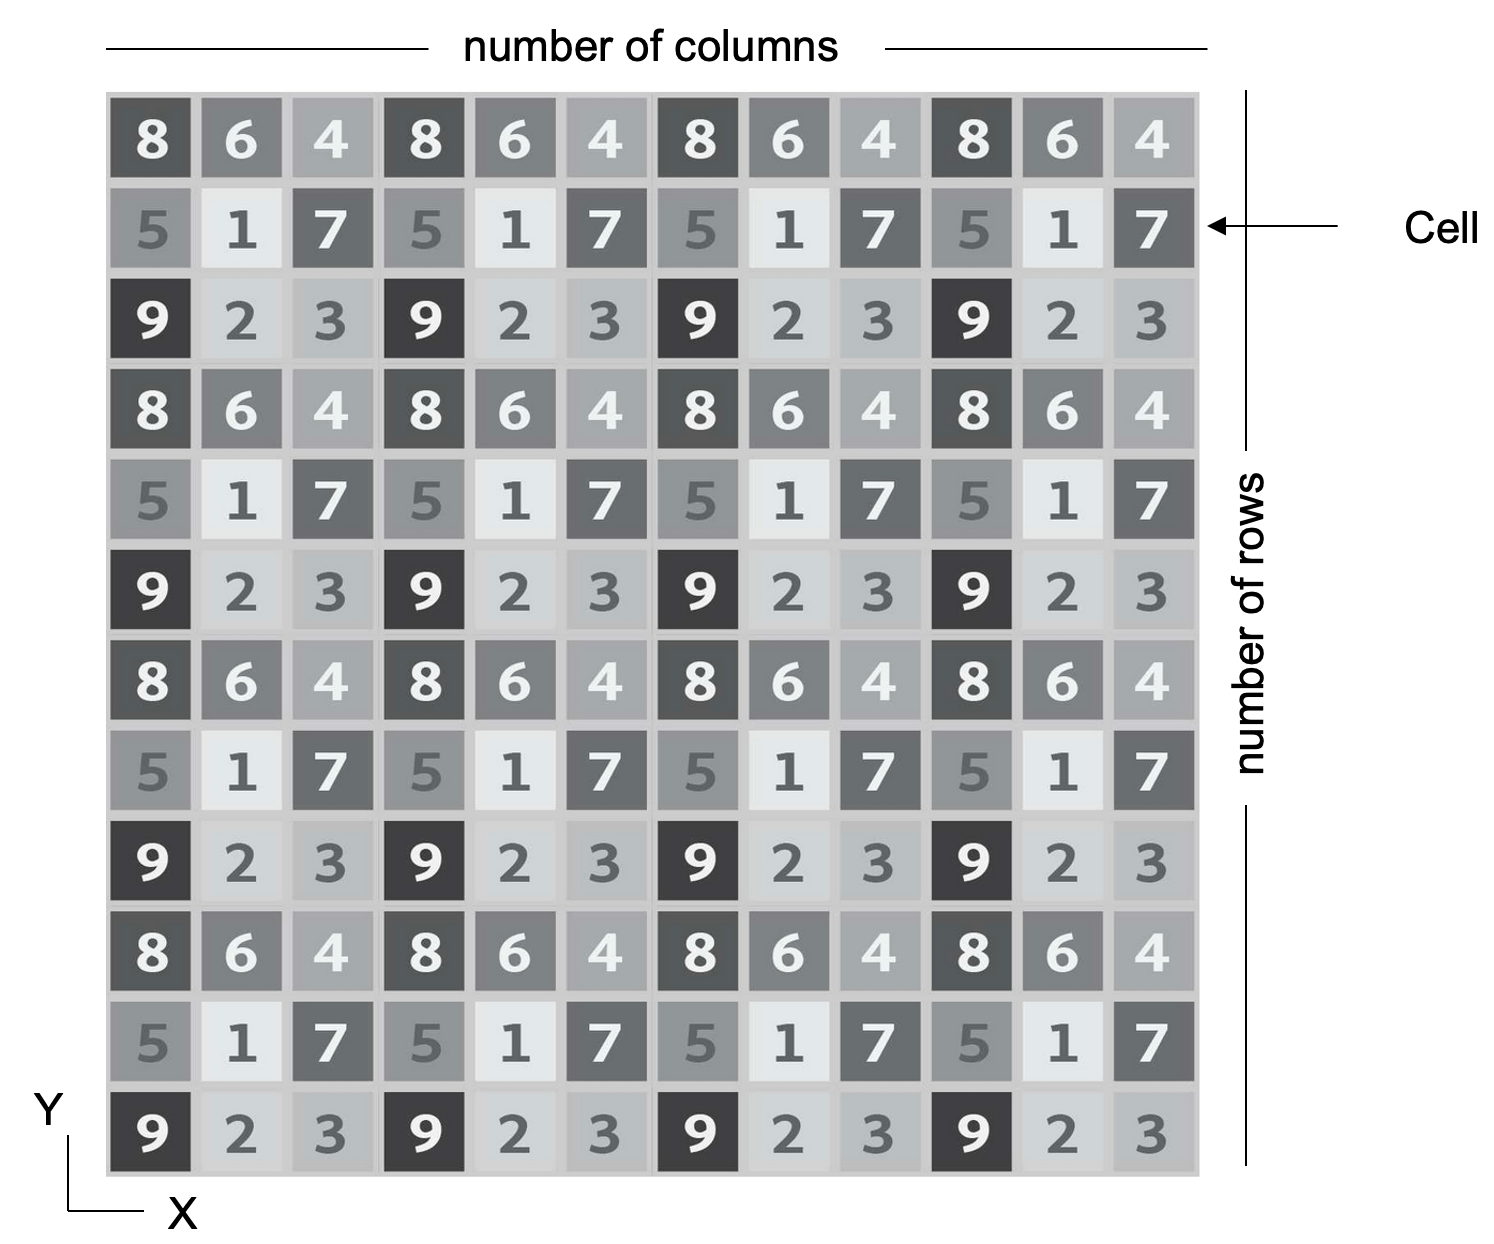
The raster model represents geospatial data as two dimensional matrix, or grid, of cells. The grid is characterized by a georeferenced origi and the cell size.
Formats for geospatial data files
Geospatial data are stored in disk files in formats that are automatically decoded by geospatial applications. Common formats for geospatial vector data are shapefile, GeoJSON, KML, TabInfo and others. Geospatial raster data are stored in GeoTIFF, TIFF, GeoJPEG, netCDF and others. One layer might be composed by more than one files.
 |
 |
Activities
 |
Geospatial datasets for São José dos Campos city. |
- Install the QGis in your desktop
- Download the geoespatial data from São José dos Campos city, to explore in the next class.